My Allocatesmartly Tactical Asset Allocation: 2025 > 2026
Five years testing TAA models revealed the math isn't complex—discipline is. Learn how momentum scoring, regime detection, and tranching work with Optimum 3, All Weather Quad, and GTAA-3.

First off: 2025 was a great year for everyone who was invested. My 3 combined TAA models ended with 20.25% across my 4 accounts. I could have done better, but I couldn't just stop testing until mid-February 2025, when I removed all Canary and reverted to Fast-Tactical traditional rules-based models. In 2026, I decided to get more aggressive with the weightings, and this article is about that.
Most tactical asset allocation models feel like black boxes. You see the performance curves, read about "proprietary momentum composites" and "regime-aware diversification," but the actual mechanics remain frustratingly opaque. Is there really secret math at work in these systems, or is opacity just good marketing? Most models are disclosed, and some are not. Financial Mentor's models are two that are not disclosed. But I have tested them since Todd introduced them, and they are the best of any models I have tried. Even if they are blackboxes.
I spent the last few years building, testing, and refining my TAA implementation using models from AllocateSmartly, guided by principles from Todd Tresidder at Financial Mentor. What I discovered surprised me: the math isn't the secret sauce. The discipline is. While I had minor differences in percentage accuracy across configurations, tweaks, tranches, weightings, and how I split my accounts within the portfolio setup in AllocateSmartly, this helped me in determining how to approach tranching and weighting. AI was also a great help to distill all of my data I tracked and measured over the last 5 yrs - since March 2020.
This is NOT a story of reverse-engineering the models; it's more about optimizing the implementation, running it through real market conditions, and learning that some of my "optimal" theoretical work mattered less than I expected.
The Core Problem: Risk Control vs. Return Chasing
Before diving into mechanics, I want to explain what TAA actually tries to solve. Traditional buy-and-hold investing operates on a simple premise: markets go up over time, so stay invested and accept all drawdowns. While this section does not give the debate credit, Todd's course covers many of the differences and risks, and his community will discuss buy/hold in the forums that he gives them access to as part of the course fee. They are basically deprogramming themselves from the mass-market promotion of the Buy/Hold approach. If you search the financial news and blogs for "Issues with Buy and Hold or 60/40 portfolio," you will get dozens, if not 100s of articles, some very recent, that argue against the 60/40 buy/hold approach methods.
What does AI say? →
The implicit buy/hold math is straightforward:
- Expected return > 0 over long horizons
- Time diversification smooths risk
- Volatility is tolerated, not managed
In practice, this means your portfolio return equals market return times your allocation. When markets drop 50%, you need a 100% gain just to recover to break even to the point where it started when the loss occurred. Risk is experienced, not controlled.
TAA fundamentally challenges this framework. The insight isn't that markets don't go up over time—it's that returns are asymmetric. Avoiding large losses matters more than capturing every gain.
The analogy I keep coming back to: traditional investing means you're always in the car, even when the road is icy. TAA means you slow down or pull over when conditions worsen.
The Math That Matters
Here's what shocked me most: almost all TAA logic reduces to a single inequality. Which maps to Todd's Expectancy Wealth Course and the formula that he has promoted for over the last 10+yrs. His formula is a bit different but essentially mirrors this. You will have to review his site and buy his course if you want to learn more.
If Expected Return - Risk Penalty > 0 → Invest
Else → Reduce Exposure
Its not using any statistical models like Black-Scholes derivatives and no Monte Carlo magic. Just conditional exposure based on whether the risk-adjusted opportunity is positive.
The "risk penalty" can be measured through:
- Volatility spikes
- Drawdown thresholds
- Trend breaks (price below moving average)
- Relative weakness (asset ranks poorly vs. peers)
You can see inside the the tools that AllocateSmartly provides but you can build Excel spreadsheets too. Albeit at huge time cost.
This single risk framework explains momentum strategies, trend following, defensive rotation, and cash filters. Everything else is implementation detail.
What actually differs between TAA models:
- Lookback windows (3/6/10/12 months, or blended)
- Ranking methodology (absolute vs. relative momentum)
- Volatility filters or crash switches
- Rebalance cadence
- Asset universe
The edge comes from discipline and risk constraints, not clever equations. When I built my own basic momentum composite in a spreadsheet, it tracked commercial models surprisingly well. The remaining differences came from execution details, not mathematical sophistication. This was a directional experiment and not a true reverse-engineered TAA model. What it did was validate the model approaches and helped me, visually, build more confidence.
Explaining the Models the best I can using AI and my own Research
I chose three models from AllocateSmartly for my implementation. Two were created by Todd Tresidder, and he does not disclose the underlying math, but there are clues and aspects that are surfaced to allow the user to make a viable decision about whether to use his models. Allocatesmartly explains, at a surface level, what the models are doing.
Performance alone is not enough to convince a user to use Todd's models, but they are probably the most used models on AllocateSmartly. The other model I use is based on the work of Meb Faber, who publishes his rules and how they are configured, as well as his book on Global Tactical Asset Allocation on Amazon.
Understanding what each actually does, not just what they're called, became essential. I am not here to critique, disclose, or reverse-engineer the math, or argue that all of them should be public or not. That is the author's/owner's choice. This article is meant to help you build some confidence in TAA and in questioning your CFP(Certified Financial Planner) and the mass-marketing of 60/40-style investing, because it's broken. If you still want to use a CFP find a fee-only agency vs anyone charging AUM %. (AUM=assets under mngt.)
Financial Mentor Optimum 3: The Aggressive Trend Follower
Despite the benign name, Optimum 3 is the most aggressive model I'm using. Here's what AllocateSmartly , AI (Claude), and what I think it is actually doing. I am not reverse-engineering the math; that is not possible, but we can make some assumptions to determine whether this model manages risk and delivers a good performance-to-risk ratio. Here is my interpretation of the model on AllocateSmartly.
At each monthly rebalance or each Tranche date, which is monthly in AllocateSmartly:
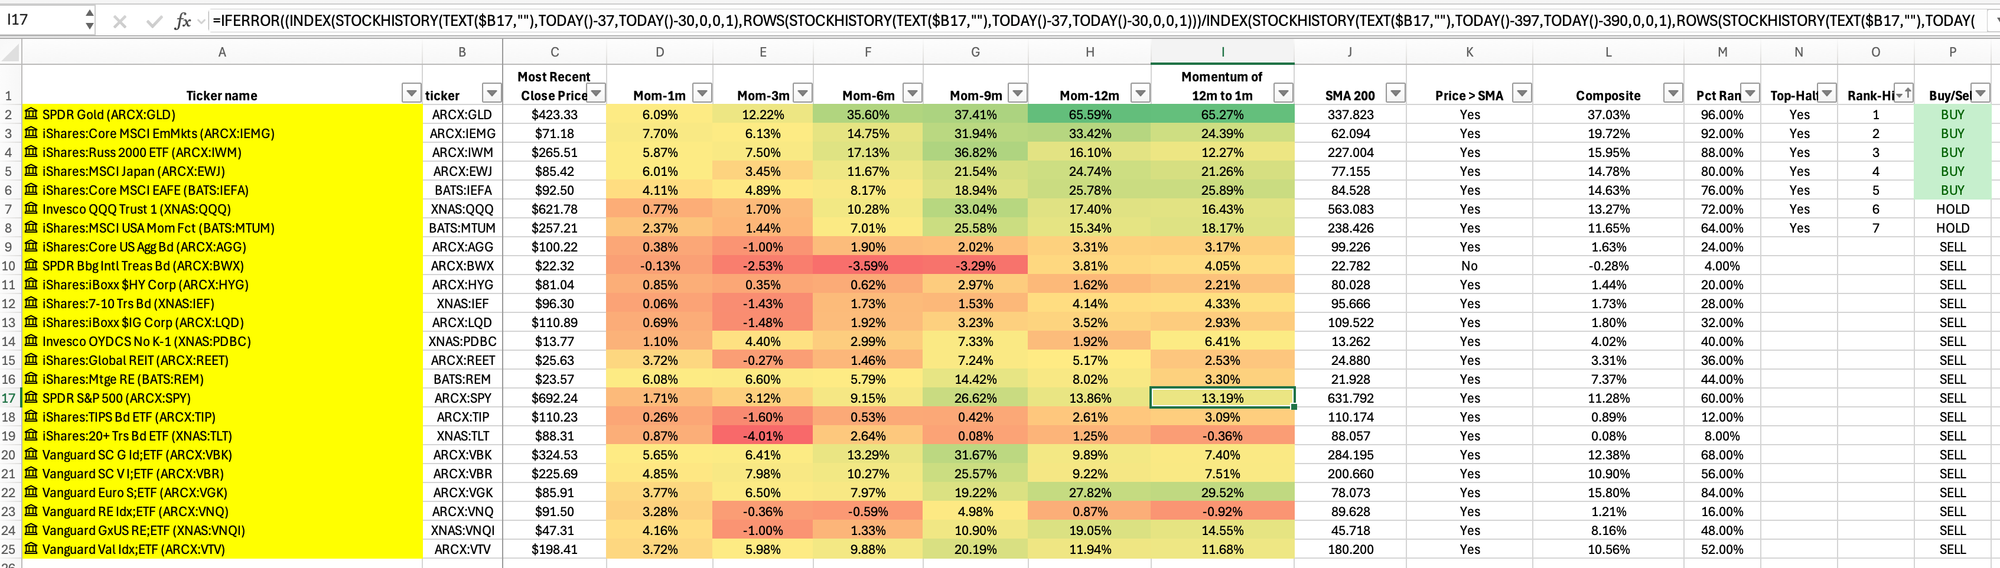
- Calculate composite momentum scores for each asset in a tight universe (typically 3-5 assets: US equities, international equities, real assets, defensive positions). Todd uses 16 ETFs across all asset classes in his universe, which AllocateSmartly applies within its platform. This allows the model to rotate in and out of bull markets depending on the economic regime. The universe allows the diversification, but rotates into and out of it when the evaluation math says to. Here is a snapshot - even though we do not know the math. Note, I have no idea how close this is to his models. It's really just a generic assessment on how the mechanics might work. Most of it is what he discloses on AllocateSmartly.
The score is a weighted blend of trailing returns:
Score = w₁·Return(3mo) + w₂·Return(6mo) + w₃·Return(12mo)- Apply an absolute momentum gate - this is the critical filter:
If Score ≤ 0: Asset is excluded, period- Rank eligible assets and select the top 3
- Weight equally or with light volatility normalization
What makes Optimum 3 distinctive is its willingness to go 100% defensive. If nothing passes the absolute momentum gate, the entire allocation moves to cash or short-term treasuries. Note how this is fundamentally different from full diversification in buy-and-hold.
You aren't holding onto ETF assets in categories that are losing when the market is down, waiting for them to recover. You are moving in/out of them and into a defensive or offensive stance when it presents itself, based on the math applied. This is the case for most TAA models.
This design explains its behavior:
- Excellent return capture during sustained trends
- Fast risk-off during regime breaks
- Higher turnover and whipsaw risk
- Can underperform during sideways, choppy markets - I find this is a pro because you are not risking a drawdown like buy/hold.
The model is optimized for avoiding catastrophic losses, not for super-smooth returns, but it does help.
FinancialMentor - All Weather Quad: Not What the Name Suggests
This one is a bit harder to explain and much harder to mimic in Excel when you do not know the math or the parameters that trigger it. When I first allocated to "All Weather Quad," I assumed it would be the conservative, stable component of my portfolio. I was wrong. However, I was still drawn to it based on its specific, small, concentrated grouping of assets. Which creates an aggressive approach.
AWQ historically exhibits the highest volatility and largest drawdowns of my three models. The "All-Weather" label is conceptual, not descriptive of its risk profile. Its similar. but different than other AWQ models - refer to AllocateSmartly's blog for a better definition. In the meantime, here is how visualize it.
The "Quad" framework:
The name references four economic regimes and my interpretation of Allocatesmartly's explanation. I am not sure if this is correct, but I had some help illustrating and describing it using Claude AI by asking it different questions about this model and others like it. I am not disclosing any math because I don't know it, but thinking about the model this way convinced me it's my best model of the triad in my mix. Here is the foundation idea - again, this is theory and conceptual for visualizing how something like this model might work:
| Regime |
Growth |
Inflation |
| Quad 1 |
Rising |
Falling |
| Quad 2 |
Rising |
Rising |
| Quad 3 |
Falling |
Rising |
| Quad 4 |
Falling |
Falling |
But here's the key insight: AWQ doesn't forecast GDP or CPI. It infers regimes from asset price behavior, or so it seems. However, in 2022, it had terrible performance, mostly because it was a wildly weird year across all markets. Trend strength was wild, and volatility was all over the place across all asset classes. i.e., the Quad regimes were all over the place, so it had a hard time pinning down the right assets. However, as 2022 transitioned into the new regimes, the model outperformed all others on AllocateSmartly.
How it likely works:
Instead of ranking assets to pick winners, AWQ does conditional allocation across multiple sleeves:
- Measure multiple signals:
- Trend strength across asset classes
- Volatility levels
- Relative strength between stocks, bonds, commodities, and defensive assets
- Infer regime probabilistically:
- This one is super hard in my opinion - but financial quant models are not my area of expertise, and so the math and parameters available from the markets are a bit opaque for me. However, I did ask Claude, and the story is too long to include about how this step might be used, so feel free to do some deep diving on your own. There are probably about 3-4 different options. It could be approached from simple scoring to more advanced probability-based methods like Markov or K-Means. I doubt AllocateSmartly or Todd would use or support the latter options. So I suspect it's a simpler approach, using a scoring method. During my career, we used the last two a lot in digital marketing to target user profiles with different propensities to buy or not. So, in theory, the same type of math could be used for financial asset scoring. Here is the rule set:
If equities are strong + vol low → growth regime
If bonds  are strong + equities weak → deflation/slowdown
If commodities are strong → inflationary regime- Allocate across multiple positions simultaneously - no single "all-in" bet unless it's cash.
- Apply risk-balanced weighting - often volatility-adjusted
What AWQ optimizes for:
- Macro-aware diversification without forecasting
- Maintaining exposure across regime types - Todd talks about regime changes in his newsletters, course, and the course forums constantly. Explicitly, what he calls Epochal Regime change - this is a higher, more macro level than what AWQ is doing, but the concept contextually is the same. So it makes sense that this is a component included in the model.
- Drawdown reduction through diversification (though it still has the highest volatility in practice)
The model accepts lower upside capture than Optimum 3 in exchange for what should be better worst-case behavior. The historical data shows more complexity. It can and did vastly exceed the returns of every other model on AllocateSmartly in 2024 and 2025 for well-diversified models - i.e., more than 6 assets to choose from. It exceeded 30% returns in 2025 and over 20% in 2024.
GTAA-3 (Faber): The Simple Backbone
Meb Faber's GTAA-3 is the cleanest, most transparent model in my portfolio. Faber, founder of Cambria Investments, essentially popularized tactical asset allocation worldwide through his influential research and books on global tactical asset allocation strategies. His approach is elegantly simple. Todd is also very complimentary of Meb and his approach.
GTAA-3 follows three assets: US equities, international equities, and bonds.
The logic is mostly binary - this is even more of a simplified version:
Each month, for each asset:
If trailing 10-month return > 0: Hold the asset
Else: Move to cash/short-term treasuries
This is a simple definition for the most part - AllocateSmartly posts the deeper math, and Meb publishes the explanation in his white papers and books. No composite scores. No regime inference. Just absolute momentum with a 10-month look-back - aka 200-day SMA. I am not giving it a deep analysis or justice that AllocateSmartly does on its website, so if you need deeper analysis, read Meb's GTAA whitepaper or go to the AllocateSmartly blog.
What GTAA-3 brings:
- Lowest volatility of the three models
- Smallest historical drawdowns
- Long periods in bonds or cash during bear markets
- Late entries and exits (12-month window is slow)
- Structural trend filter that's durable but not nimble
GTAA-3 is insurance, not a return engine. It kills drawdowns, but over-weighting it also kills returns.
The Implementation: Three Tranches, Nine Rows
Understanding the models was step one. Implementing them efficiently was step two. It has taken me 5 years to un-program my brain and my aka big "engineering-type" Analyst brain. I have always been sold on TAA from day one, as it was what I was searching for before I even ran into Todd Tressider and FinMentor. I just could not swallow another AUM of 1% that the CFA/CFP's charge – it's robbery. So I tested and tested and finally think I am in a place where I have bought in 100% to the 3 models I will always use from now on, unless another pops in that completely alters my mind.
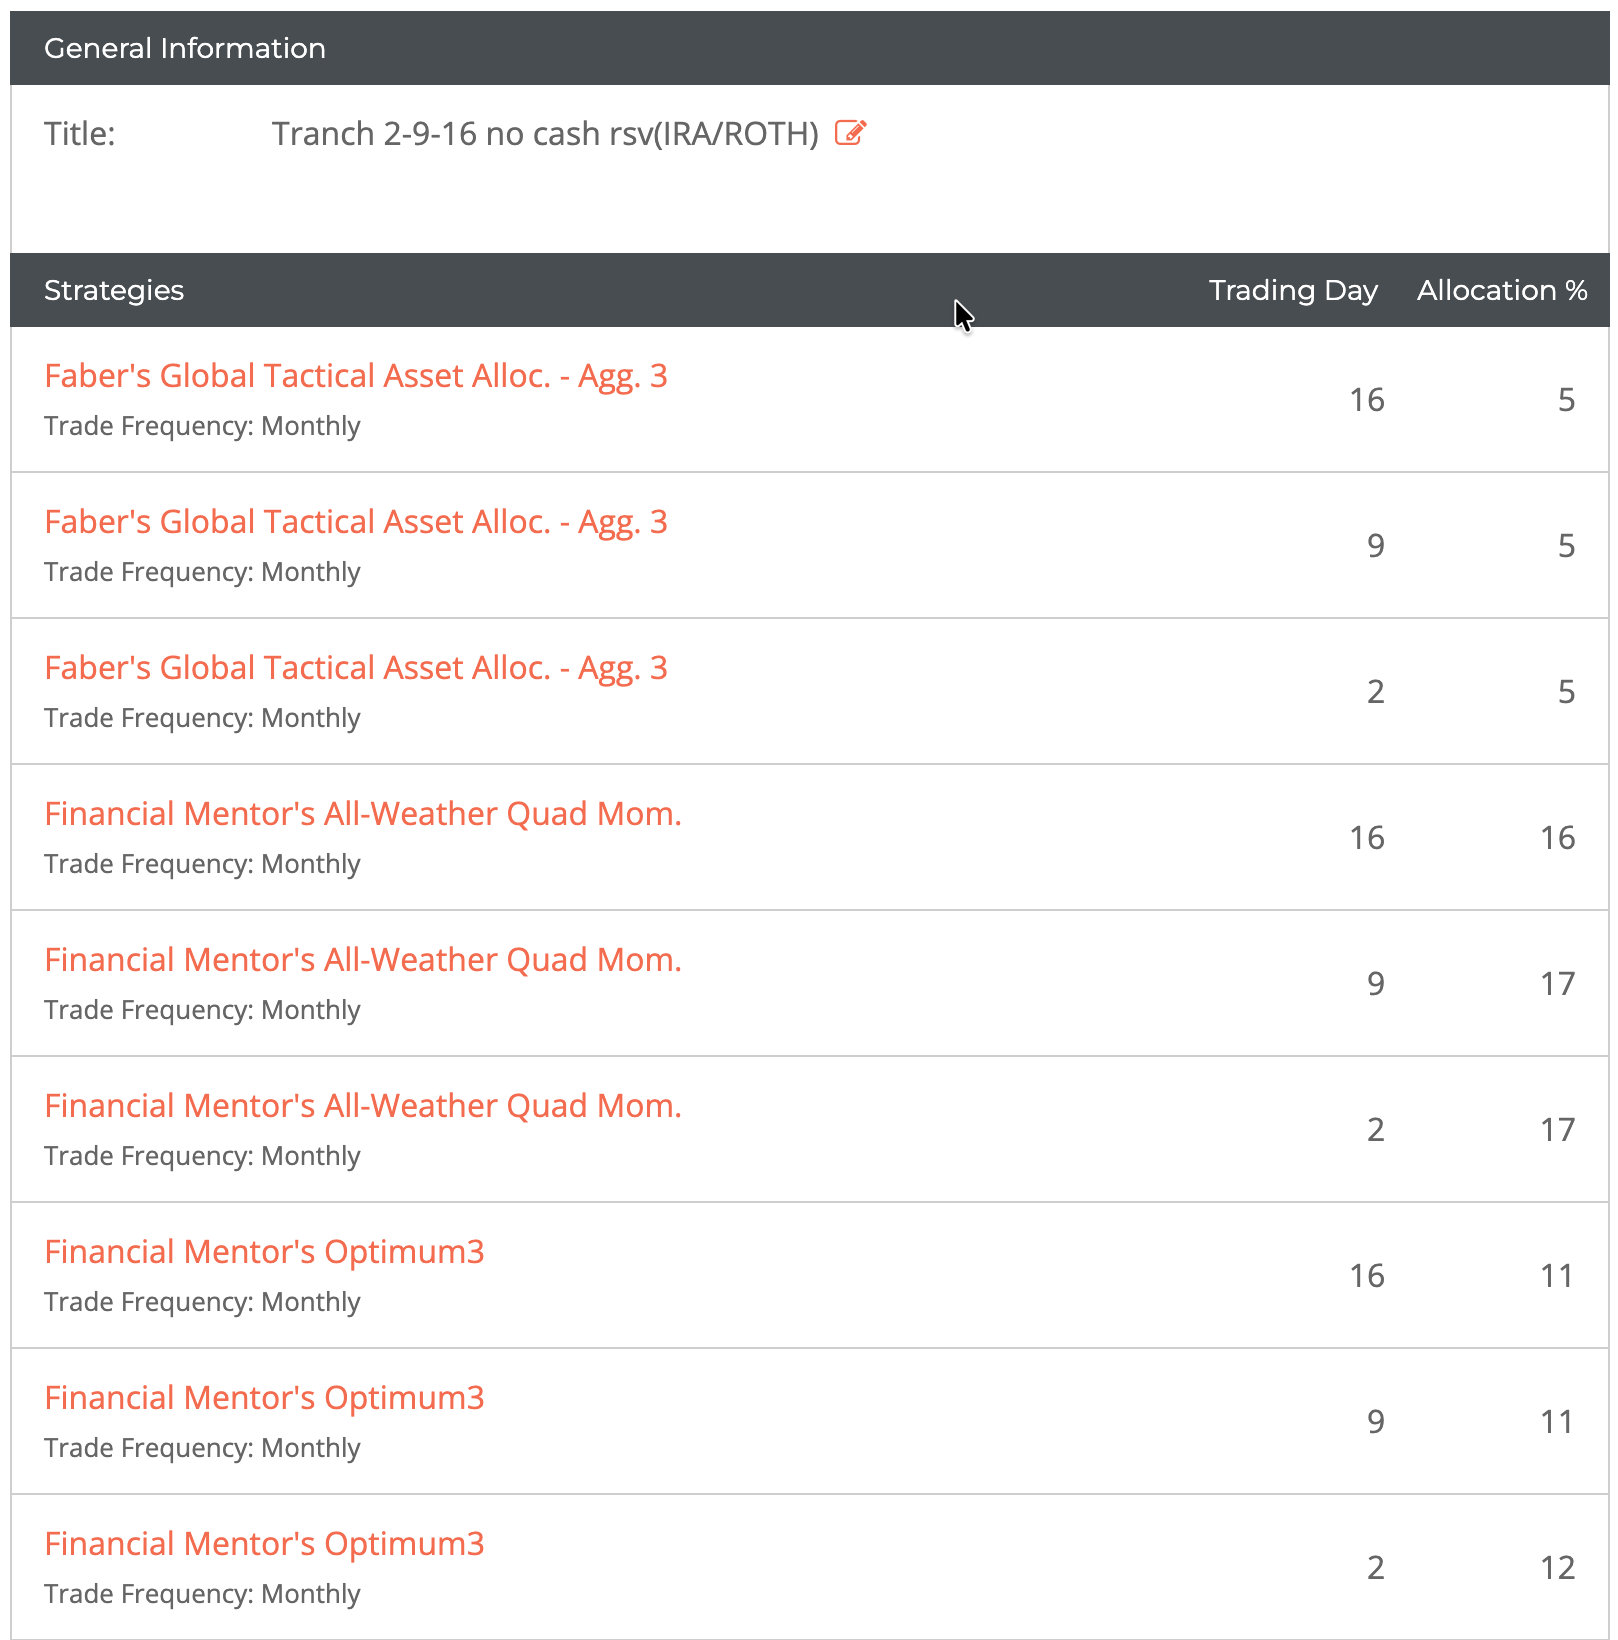
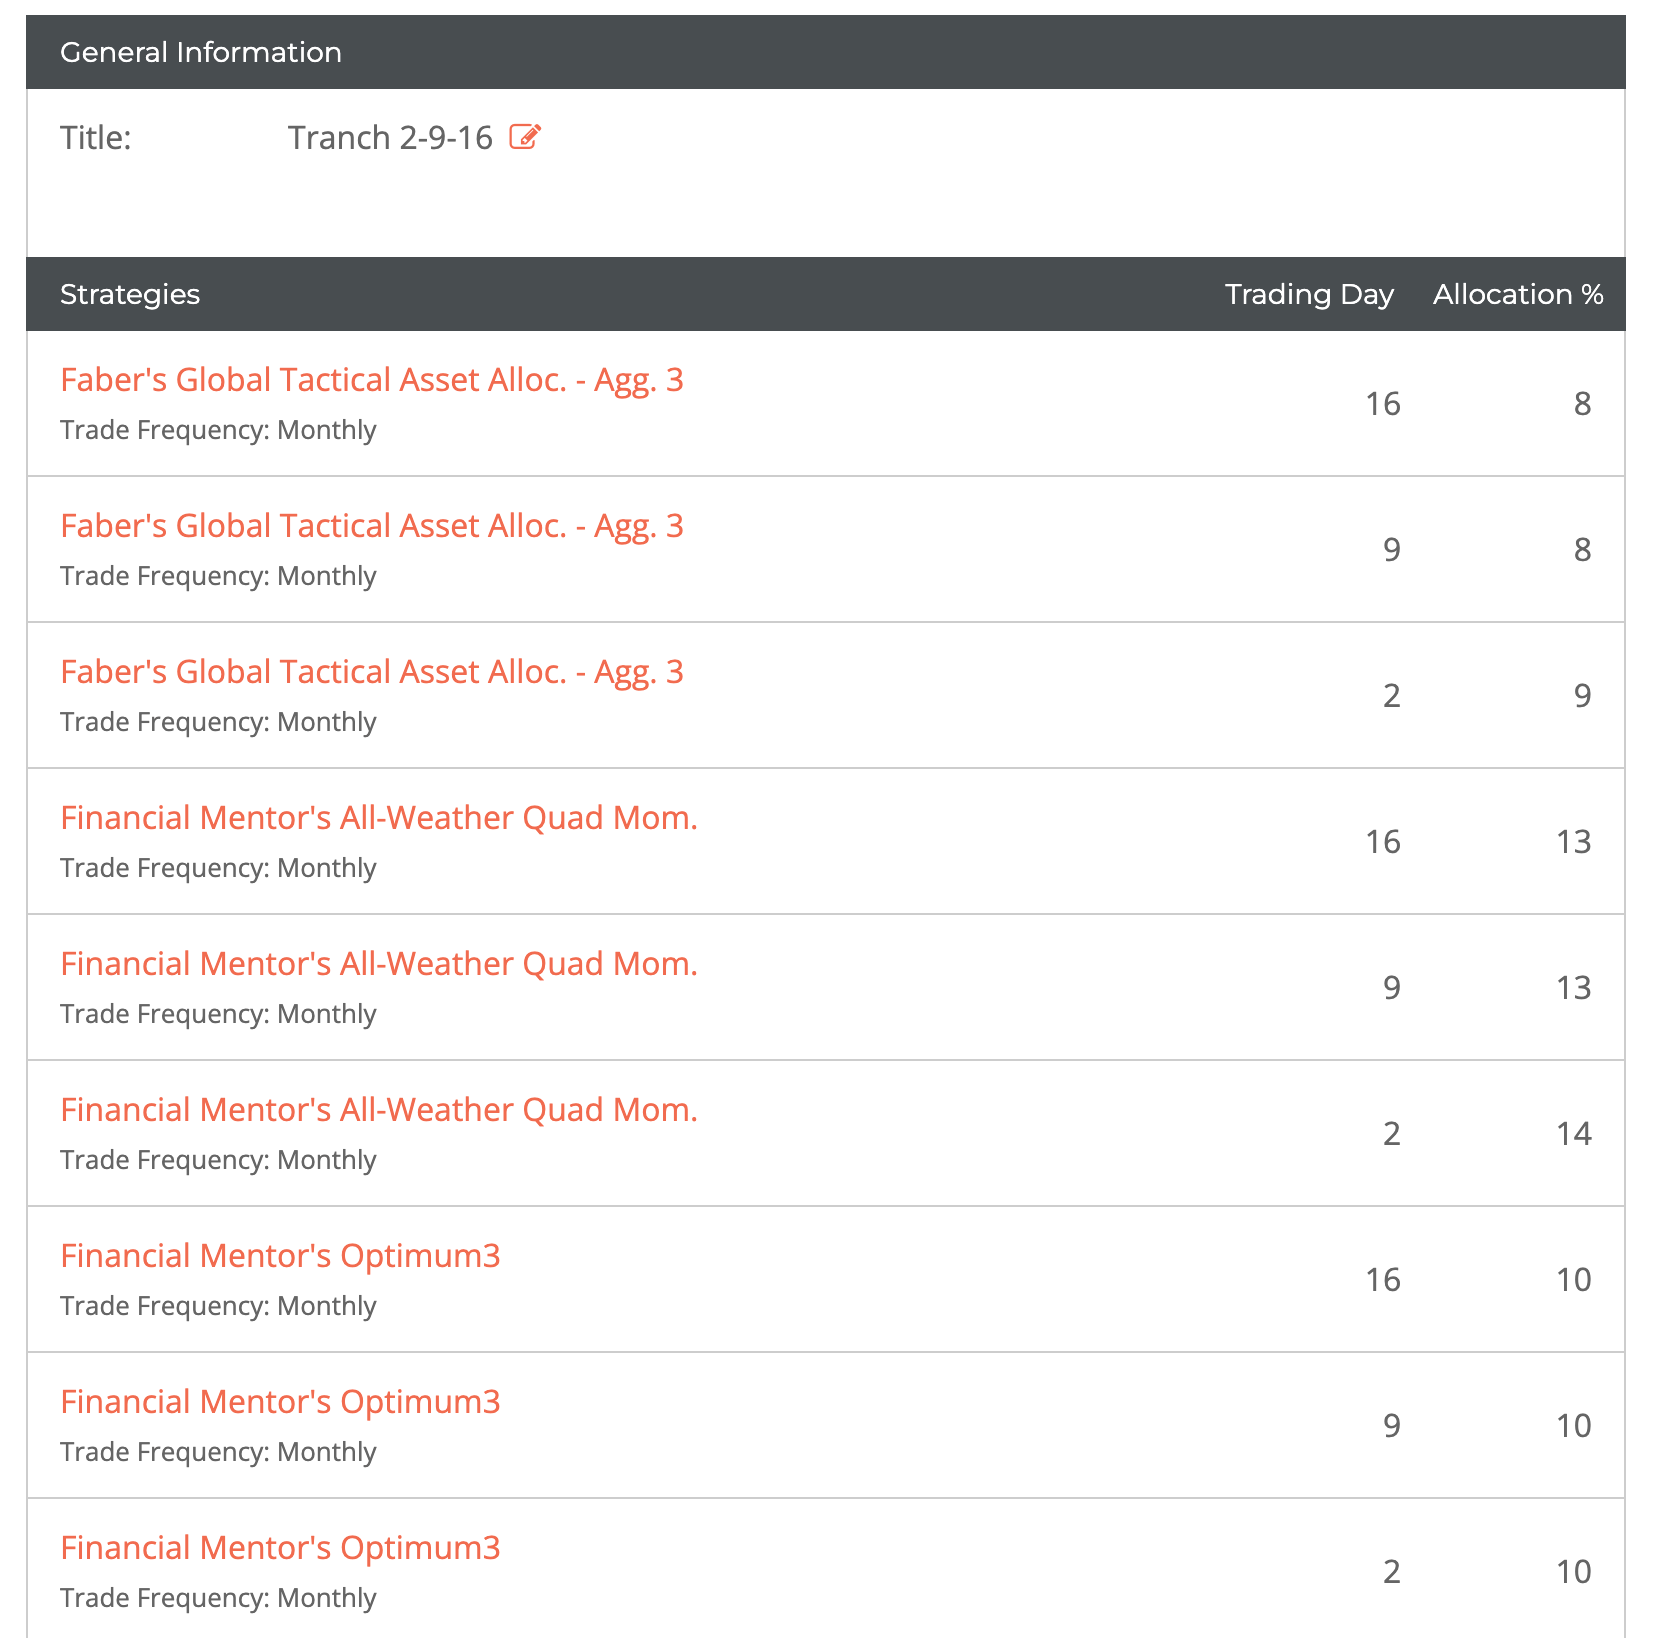
I use a tranching system - AllocateSmartly automatically adjusts using this mode to reduce timing risk if you use it and set it up. It has been talked about ad nauseam on the Finmentor and Reddit boards. Todd advocates for it to help smooth and mitigate mid-month risk. Each model is split into three equal tranches, executed on different trading days within the month. I have tried different dates and variations of it based on my digital analytics career, as we used tranching in various ways with that data, too. So the concept was not lost on me. This creates nine total execution rows in AllocateSmartly:
- Tranche A: Trade day 2
- Tranche B: Trade day 9
- Tranche C: Trade day 16
Most people use 7, 14, and 21 trade days. This is the common split. I just pushed it out a couple of days. I have backtested both in AllocateSmartly's compare tool - the basic difference is negligible. My dates seem to work better in 3-5-year swaths, and the 7, 14, 21 work better over 30-40-year swaths, but not by much. I am not sure which dates are better, or how much it matters. The timing just worked better for me when I started implementing, so I stuck with it.
Each tranche follows its model's signals independently. Basically, you are adjusting each Tranche every 30 days. They are each mutually exclusive. This doesn't improve expected returns—it smooths execution timing and reduces the regret of "what if I'd rebalanced a week later?" It also reduces the risk of unexpected mid-month drawdowns.
The Weighting Problem: 2025>2026
This is where things got interesting. Ihad been testing since March 2020, when Covid collapsed the market, and Todd introduced AllocateSmartly to the broader FinMentor class group. I went all in and cashed out all my ETFs. I had lost 50% of my portfolio. I am still getting tax losses on this in my annual returns today. haha. But.... TAA gave me a radical new way to invest and control another 50% drawdown in my lifetime. Hopefully... but I still did not know how to pick the right model or the right weights when I mixed models in the AllocateSmartly tool, which is their value sauce. This ability is worth millions of dollars because no CFP or paid broker can replicate it.
Initial Assumption: Equal Weighting - 2025
I started 2025 with roughly equal capital across all nine rows—about 11% per row, with a small cash buffer. This was defensive: I didn't fully trust my understanding of the models, so I diversified equally across all three decision logics. It wasn't bad as I gained 20% in 2025. My best year ever - although since starting TAA, my CAGR March 2020-January 2026 is 11.89%, even with the testing, the 2022 drawdown, and terrible returns from using a couple of canary models in 2023 and 2024.
The 2025 weighting:
- ~33% Optimum 3
- ~33% All Weather Quad
- ~33% GTAA-3
Optimization - 2026
As I studied the models more deeply and reviewed their historical performance on AllocateSmartly, a problem emerged: equal capital weighting doesn't equal equal risk weighting. So I asked ClaudeAI for help. I just could never figure out the weightings that gave me peace of mind - it was vexing, and my big brain was just kept wanting to tweak. So I needed someone to tell me what the weight should be. Even if it is wrong, it doesn't matter. I just wanted someone else, no matter who, to tell me. We used to say this in software: "Customers always want you to tell them what to do, not give them options to choose from." Too many options cause indecision, and that is what kept happening to me.
Based on actual historical behavior:
- AWQ: Highest volatility, largest drawdowns, highest CAGR
- Optimum 3: Moderate-high volatility, cleaner momentum logic, faster risk-off
- GTAA-3: Lowest volatility, smallest drawdowns, lowest CAGR
Equal weighting was accidentally overallocating to the lowest-return model (GTAA-3) and underallocating to the highest-return model (AWQ).
Risk-Normalized Weighting
The correct approach in TAA is to weight by the inverse of risk contribution. Or at least this is what AI is saying when I am asking all sorts of questions - whether this is right, I am not 100% sure. This means that higher-volatility models should receive smaller allocations, except when their expected returns justify the risk. Therefore, I am willing to take more risks with AWQ. Given its higher volatility, it offers better expected returns. So knowing that, the drawdowns with tranching would probably never reach or exceed the drawdown returns I have experienced in my life with Covid 2020, the GFC 2008, and the Tech bust of 2000. So leading with AWQ made the most sense in 2026, and in the future, if I am willing to accept the risk. I roughly started investing in 2000, but did not really get serious about saving and lifestyle reduction until 2012. I was around 45-yo.
I calculated what I believed were optimal weights with the help of Claude for my 4 account types:
For tax-advantaged accounts (IRA, Roth, and HSA - only these 3):
| Model |
Total Weight |
Per Tranche |
| AWQ |
50% |
16.67% |
| Optimum 3 |
35% |
11.67% |
| GTAA-3 |
15% |
5.00% |
For taxable accounts (with withdrawals - I only have one Tax account):
| Model |
Total Weight |
Per Tranche |
| AWQ |
40% |
13.33% |
| Optimum 3 |
30% |
10.00% |
| GTAA-3 |
25% |
8.33% |
| Cash |
5% |
n/a |
The taxable account is more conservative because it funds a monthly withdrawal to meet my expenses — a higher GTAA-3 allocation for stability, plus a cash buffer to avoid forced selling. Honestly, the testing and backtesting comparisons aren't dramatic. I just need a bigger cash cushion for W/D.
The logic goal was: maximize expected return per unit of risk, tilt aggressive models toward tax-advantaged accounts, and maintain liquidity for distributions.
Transparency Over Opacity
The irony isn't lost on me: I started this investigation frustrated by the opacity of TAA models. Now I understand why that opacity exists. Not just Todd's models but all of them. It takes years to understand them - not just the math, but a mental shift in your brain about risk. I am an analyst and programmer, so this shift was extremely difficult. I am just curious by nature, so the black boxes and lack of transparency were beguiling.
It's not because the math is sophisticated—it isn't, and even Todd has said experts can try and probably could reverse-engineer his models or others in the list. That wasn't my goal. The models I've described aren't doing anything you couldn't replicate in a spreadsheet with some careful thought or AI assistance. The opacity exists because simplicity undermines perceived value.
Todd Tresidder's edge isn't mathematical cleverness. It's knowing what not to optimize, avoiding fragile precision, and designing for human and market behavior rather than over-optimizing on backtest performance. As he has said recently, this is worth millions.
But for those of us implementing these strategies with our own capital, transparency matters more than mystique. Understanding what's actually happening. The composite momentum scores, the absolute gates, and the regime inference logic build confidence to execute when it's hardest. We do not need to know the exact math, but understanding the logic and mechanics gives us peace of mind.
That confidence, not the formulas, is what makes TAA work, and that is why I chose Todd and Meb's models. They are simple yet confident in their approach.
Final Thoughts
If you're considering TAA, here's what matters:
The math is simple. One inequality explains everything: Expected Return - Risk Penalty > 0. Todd's Tressider's entire course is based on the Expectancy Wealth formula.
The models aren't magic. They're measuring trends, ranking assets, and controlling exposure. Small differences in look-back windows and weighting lead to divergent behavior over time, but the core logic remains accessible.
Discipline trumps optimization. My equal-weighted "training wheels" approach performed in 2025 nearly identically to my carefully risk-tilted optimization. Execution consistency mattered far more than the weight differential. I just need to accept the next drawdown for higher returns now, rather than lower returns and lower drawdowns with other models and weightings that I tested in 2021-2024. e.g. carnary models. Hopefully, the discipline will improve my 11.8% CAGR or keep it steady.
Risk control is the real product. TAA isn't about beating the market—it's about surviving it. The value is in drawdown management and behavioral error reduction, not alpha generation.
Transparency enables confidence. Understanding what's under the hood doesn't make the strategy work better, but it makes you more likely to stick with it when it's uncomfortable.
The road ahead is still icy, and most likely a big drawdown is coming. But now I understand exactly how my system decides when to slow down, when to pull over, and when to accelerate. That understanding, paired with consistent execution, has proven more valuable than any optimization.
This implementation uses models from AllocateSmartly and draws on principles from Todd Tresidder's work at Financial Mentor. All analysis and conclusions are my own, with the help of Claude and ChatGPT, and based on trial and error using my personal portfolios. I am not a licensed Financial planner so everything here is not advice. It is only a story of my journey.
Frequently Asked Questions (FAQs)
Q: What is the core mathematical principle behind tactical asset allocation models?
A: Most TAA models operate on a single fundamental inequality: Expected Return - Risk Penalty > 0. If this condition is met, the model invests; otherwise, it reduces exposure or moves to cash. The "risk penalty" is measured through volatility spikes, drawdown thresholds, trend breaks (like price falling below moving averages), or relative weakness compared to peer assets. Despite appearing complex, TAA models don't rely on sophisticated derivatives pricing or Monte Carlo simulations—they use conditional exposure based on whether risk-adjusted opportunities are positive.
Q: How does tranching reduce timing risk in tactical asset allocation?
A: Tranching splits each model into three equal parts executed on different trading days within the month (commonly days 7, 14, and 21, or variations like days 2, 9, and 16). Each tranche follows its model's signals independently, rebalancing every 30 days. This creates 9 total execution rows when using 3 models. Tranching doesn't improve expected returns but smooths execution timing, reduces regret from single rebalancing dates, and mitigates the risk of unexpected mid-month drawdowns by dollar-cost averaging your tactical positions.
Q: Why does All Weather Quad have higher volatility than its name suggests?
A: Despite its conservative-sounding name, FinancialMentors All Weather Quad (AWQ) historically exhibits the highest volatility and largest drawdowns among common TAA models. The "All Weather" label is conceptual, referring to its four economic-regime framework (rising/falling growth and rising/falling inflation), not to its risk profile. AWQ infers regimes from asset price behavior and allocates across multiple positions simultaneously using volatility-adjusted weighting. It's similar but different from other All-Weather models. See AllocateSmartly's write-up on FinMentor's AWQ. While it underperformed dramatically in 2022 when regimes shifted rapidly, it subsequently outperformed most models in 2024-2025, exceeding 30% returns.
Q: What's the difference between equal weighting and risk-normalized weighting in TAA portfolios?
A: Equal capital weighting (33% per model) doesn't equal risk weighting because models have different volatility profiles. Risk-normalized weighting allocates based on inverse risk contribution. Higher-volatility models receive smaller allocations unless their expected returns justify the risk. For example, optimal tax-advantaged account weights might be 50% AWQ (highest volatility/returns), 35% Optimum 3 (moderate), and 15% GTAA-3 (lowest volatility/returns). This approach maximizes expected return per unit of risk rather than overallocating to the lowest-return model.
Q: How does GTAA-3's absolute momentum filter work differently from composite scoring?
A: GTAA-3 uses pure absolute momentum with binary logic: each month, for each of its three assets (US equities, international equities, bonds), if the trailing 12-month return is greater than zero, hold the asset; otherwise, move to cash or short-term treasuries. There's no composite scoring, regime inference, or relative ranking—just a simple trend filter based on the 200-day simple moving average equivalent(10-months). This definition is a simplified version so refer to AllocateSmartly or Meb Fabers book. This creates the lowest volatility and smallest historical drawdowns but also produces late entries and exits due to its slow 10-month lookback window. It functions as portfolio insurance rather than a return engine.